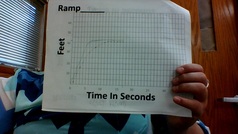
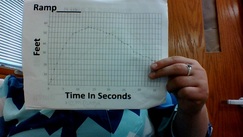
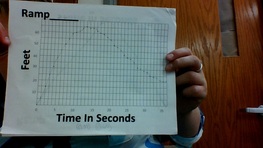
A skateboard was slid down a 21 inch ramp, a 14 inch ramp, and a 7 inch ramp. I had to predict what the graph would look like. Using the seconds and feet that the skateboard went. None of my prediction graphs are anywhere near the actual ones. On all of my graphs, the slope didn't rise as fast as the actual graphs. My initial reasoning was "slowly rise" because the skateboard's speed gradually got faster and slowed down. The zeros of my graph represent the domain and range. The last two graphs have their maximum, then decrease, but not to their minimums. The top graph(7 inch ramp graph), increases to the maximum at 43, then never decreases.
 RSS Feed
